Genius Insight Study With The Center For Biofield Studies
Pilot Genius Insight study Quantum Biofeedback Application
Download the full Genius Insight study here (pdf)
Table of contents
|
Topics |
Page no. |
|
Abstract |
3 |
|
Genius Insight health application |
3 |
|
Devices used |
4 |
|
Methodology |
8 |
|
Results |
10 |
|
Discussion |
14 |
|
References |
15 |
Abstract
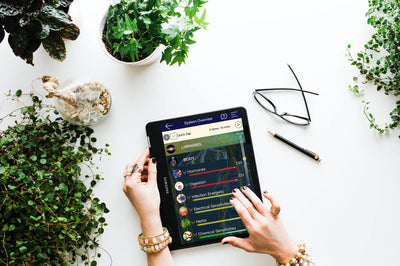
Genius Insight is an Information Coded Biofeedback application that claims to analyze the human bio-field of a person using a patented voice spectral analysis process. The biofeedback process and subsequent balancing frequencies attempt to achieve a state of harmony within the human bio-field. A Genius Insight study was designed to test the efficacy of the selected balancing frequencies in the subject's bio-field. Six people were selected randomly to take part in the Genius Insight study and were analyzed before and after listening to the balancing frequencies from the Genius Insight application. The Genius Insight study results showed a statistically significant positive change in the subject's bio-field after listening to the balancing frequencies from the Genius Insight app.
Keywords: Biofeedback, Biofield, Energy.
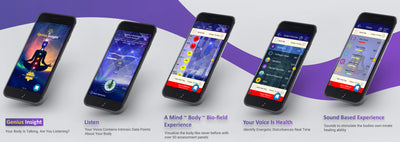
Genius Insight Application
The Genius Insight software is Information Coded Biofeedback Technology. The basic concept behind the Genius Insight software is that it provides a means of assessing your vibrational frequency. This is conducted by analyzing the unique Voice Imprint of the subject. A subject's complex voice wave file is passed through an FFT algorithm. The subject's Voice Wave sampling is then compared to a database of thousands of energetic signatures and frequencies that have been pre-programmed into the Genius Insight software.
The result of this comparison is an algorithmic scoring system. This score will be between 0 and 777, a scale that was selected by the developer. Certain scores indicate reactivity. These reactivity scores are generally below 100 and above 600. Reactivity tells us that there is some degree of disharmony between the person (or animal) being tested and the particular frequency being tested.
Examples of these frequencies include vitamin C, magnesium, the immune system, or the spleen meridian. A score above 600 is generally associated with inflammation and the Chinese medicine concept of “heat”. High scores are generally also associated with more acute issues or issues that are more superficial. Low scores, below 100, are associated with issues that are more chronic. They are also associated with the Chinese medicine concepts of stagnation and depletion. Lower number scores can be associated with more long-term issues that are more in-depth. Based on the voice imprint of a person the scores are determined and a series of patented balancing frequencies is subsequently generated from the Genius Insight app based upon the needs of the subject.
Devices Used
BioWell (EPI\GDV)
Bio-Well is a tool based on the Electro-Photonic Imaging and Gas Discharge Visualization technique (Kirlian effect) made especially for the express assessment of the emotional and energetic state of a person. The BioWell is developed by Dr. Konstantin Korotkov. An electric impulse stimulates the biological subject and generates a response of the subject in the form of photon & electron emission. The glow of the photon radiation owing to the gas discharge generated in the electromagnetic field is transformed by optical & charge-coupled device systems into a computer file. Subjects were required to put each fingertip on a quartz plate and an image displaying the photons emissions is then analyzed. GDV Technique is the computer registration and analysis of electro-photonic emissions of different objects, including biological (specifically the human fingers) resulting from placing the object in the high-intensity electromagnetic field on the device lens.
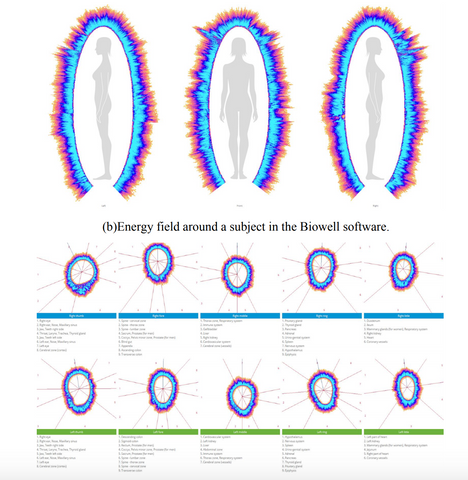
When a scan is conducted, a weak electrical current is applied to the fingertips for less than a millisecond. The subjects' response to this stimulus is the formation of a variation of an "electron cloud" composed of light energy photons. The electronic "glow" of this discharge is captured by the camera system and then translated and transmitted back in graphical representations. Fig.8(a) shows an image of a fingerprint and the corresponding aura as produced by the EPI\GDV software. Photonic emission from all the ten figures was captured each finger is connected to various systems of the body by BioWell software as shown in Fig 9. For this study, the energy, organ balance and L\R symmetry of the aura were analyzed for balance and vibrancy.
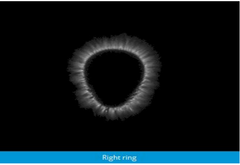
Fig. 9: Photonic emission interpretation of energetic distribution in various systems of the body by BioWell software.
Download the full Genius Insight study here (pdf)
Biofield Viewer (BV)
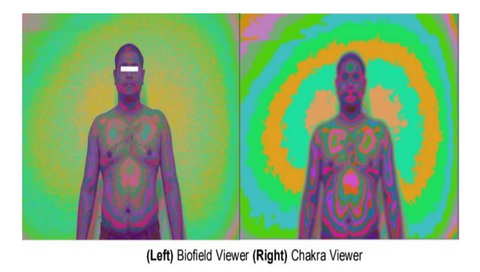
Biofield Viewer 3.5 (BV) is an advanced imaging technology that reveals light interference patterns on and below the skin’s surface. The Biofield Viewer software combined with the controlled imaging environment allows for visualization of the light photon interactions between the light source and the human biofield. The Biofield Viewer program compares the reflected rays with the incident rays and then re-codes them and produces a biofield image. The system identifies the intensity of light within the image and then gives the photons a designated number relating to color in the visible spectrum. Thus it is a digital encoding system and the smallest differences in the density of photons are recorded and viewed on a computer screen using color coding. Light striking the physical body may be reflected or absorbed. The various intensities of light differ on and around the body and Biofield Viewer allows these differences to be seen. The participant is exposed to a standardized lighting environment and should be disrobed with all jewelry removed to maximize skin exposure and minimize image artifacts. A white, matte wall provides a monochromatic background against which the BV colors are most clearly highlighted. A digital camera is used to detect the interference of biophotons emanating from the subject with the light produced from the standardized lighting system. The BV software measures the absorption and reflection of light on the skin’s surface and surroundings and then displays a composite image of the accentuated interference gradations on the screen. The second set of biofield images is placed through filtering software the Chakra Viewer application of the software introduces filters that smooth the data sets into distinct bandings. This process allows for a closer investigation of the chakras and the emotional aspects of the biofield. The Chakra Viewer is being widely used in research to monitor the effect of investigation of these images to broaden the scope of understanding of emotional, psychological, and spiritual well-being. The system reveals homeostasis in the biofield, and the Chakra Viewer now reveals the chakra live and in color. In analyzing a Chakra Viewer image, the functionality of the energy centers can be monitored. Much research has been conducted on the relationship between the endocrine glands and the chakras, as well as, the new branch of science entitled psycho-neuro-immunology.
Methodology
The Genius Insight study was conducted to test the efficacy of the balancing frequencies from the Genius Insight Information Coded Biofeedback application. Six subjects were randomly selected through word of mouth to take part in the Genius Insight study. All the subjects were scanned before listening to the patented balancing frequencies from the Genius Insight app, which serves as a baseline, and scanned after listening to the Genius Insight customized balancing frequencies for a duration of 15 minutes. The selected balancing frequencies were selected based on the results displayed by The Genius Insight App Voice Analysis. The items that yielded a high/low reactivity score were placed into the “Quick Zap” Tray on the Genius Insight app and the tones were generated for a total time period of 15 minutes.
Biofield Viewer (BV)
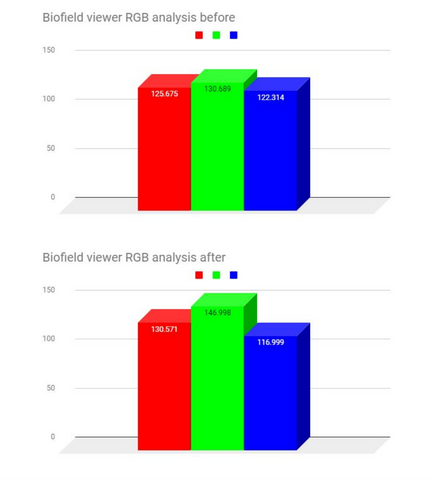
In the Genius Insight study, the subjects were scanned before listing to the customized balancing frequency from the Genius Insight app which serves as a baseline. Further images were taken after listening to the customized balancing frequency in the Genius Insight app for 15 minutes. A white LED light array is used as the primary light source and the subjects were asked to stand against a plain white background, the image of the subjects were taken in the chakra viewer mode of the Biofield Viewer software 3.5. Pixel analysis of BV scans was done using Fiji (ImageJ) to measure red, blue, and green pixels. The red pixels represent pooled or low energy. Green pixels stand for vital energy.
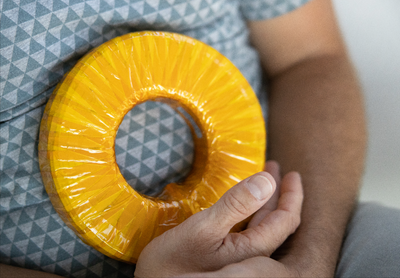
Bio-well (EPI\GDV)
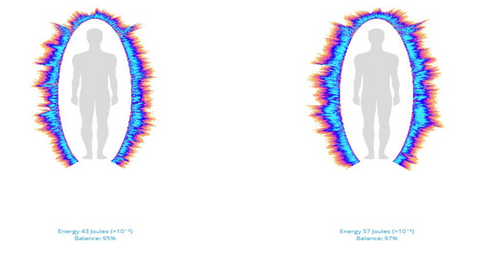
In the Genius Insight study, the first baseline scans were taken before the subjects listen to the customized balancing frequency from the Genius Insight app. The next scans were taken after 15 minutes of listening to the customized balancing frequencies from the Genius Insight app. The subjects have to place all ten fingers on top of a quartz glass plate inside the bio-well device which captures the electrophonic discharge of all ten fingers. The data recorded in the Genius Insight study is analyzed by the bio well 5.8.0.0 professional software.

Discussion
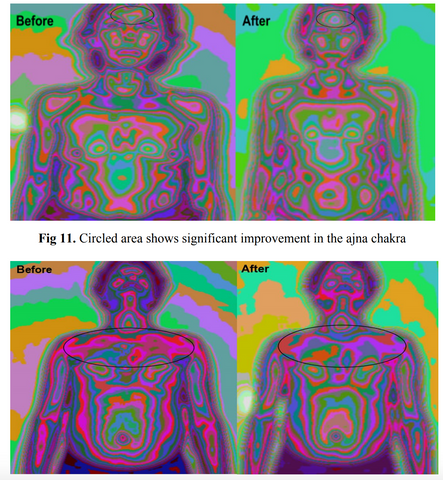
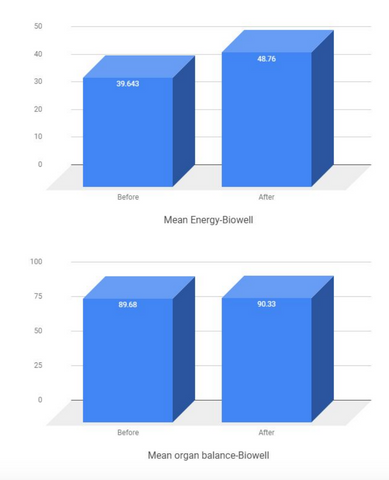
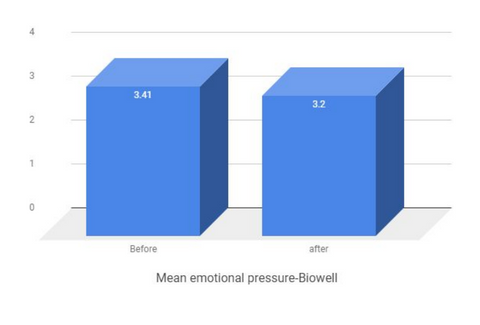
The Genius Insight study demonstrates a statistically significant improvement in the subject's bio-field after listening to the customized Genius Insight App balancing frequencies for a duration of 15 minutes. The pixel analysis in the bio-field viewer in the Genius Insight app showed a mean increase in the number of green pixels from 130.68 to 146.99 showing that the vital energy in the bio-field has increased significantly. The mean overall energy of the subject has increased from 39.643 to 48.76 and the organ balance increased from 89.68 to 90.63 which shows improvement in the bio-field. The mean emotional pressure was reduced from 3.41 to 3.2 after listening to the balancing frequency for 15 minutes from the Genius Insight app, which is an indicator of reduced stress. Also in Fig 12. there is a reduction in the congested red pixels in the chest area after listening to the balancing frequency which is an indicator of a reduction in stress.
Conclusion
The Genius Insight study results show a reduction in stress and significant improvement in the subject's bio-field. It can be concluded that the balancing frequencies from the Genius Insight application are efficient in bringing harmony to the bio-field.
Download the full Genius Insight study here (pdf)
Reference
1) Raković, Dejan. "Quantum-informational bases and frontiers of psychosomatic integrative medicine." Neural Network Applications in Electrical Engineering (NEUREL), 2014 12th Symposium on. IEEE, 2014.
2) Basmajian, John V. Biofeedback: Principles and practice for clinicians. Williams & Wilkins, 1979.
3) Prakash, Shreya, Anindita Roy Chowdhury, and Anshu Gupta. "Monitoring the human health by measuring the biofield" aura": An overview." Int J Appl Eng Res 10.2765427658 (2015).
4) Zafar, S., Streeter, T. W., Inamdar, S. S., & Sarwade, S. G. Effect of Aromatherapy and Energy Medicine on the Human Biofield: A Pilot Study.
5) Sharma, M., Bhatia, M., & Kaul, N. PREVALENCE AND ASSOCIATION OF BURNOUT WITH ORGANIZATIONAL COMMITMENT, JOB INVOLVEMENT, EXTRAVERSION AND HUMAN ENERGY FIELD ANALYSIS IN NURSES. The Journal of Indian health psychology Vol. 4, No. 1, September 2009.
6) Mark Abadi, Thornton Streeter, and Daniel Ulanowsky. A correlation analysis between four energy-field scanning devices and conscious perception of bodily issues. Focus on alternative and complementary therapies Vol 9, Issue s1, March 2004.
7) Rubik, Beverly. "The biofield hypothesis: Its biophysical basis and role in medicine." The Journal of Alternative & Complementary Medicine 8.6 (2002): 703-717.
8) Korotkov, K. G., Matravers, P., Orlov, D. V., & Williams, B. O. (2010). Application of electro photon capture (EPC) analysis based on gas discharge visualization (GDV) technique in medicine: a systematic review. The Journal of Alternative andComplementary Medicine, 16( 1), 13-25.
9) Korotkov, K. G., Matravers, P., Orlov, D. V., & Williams, B. O. (2010). Application of electro photon capture (EPC) analysis based on gas discharge visualization (GDV) technique in medicine: a systematic review. The Journal of Alternative and Complementary Medicine, 16( 1), 13-25.
[FREE] Download The Genius Insight Today!
(no purchase or credit card required)